Warning: This article assumes a basic understanding of
Why Log to Elasticsearch?
Elasticsearch is a fantastic tool for logging as it allows for logs to be viewed as just another time-series piece of data. This is important for any organizations’ journey through the evolution of data.
This evolution can be outlined as the following:
- Collection: Central collection of logs with required indexing
- Shallow Analysis: The real-time detection of specific data for event based actions
- Deep Analysis: The study of trends using ML/AI for pattern driven actions
Data that is not purposely collected for this journey will simply be bits wondering through the abyss of computing purgatory without a meaningful destiny! In this article we will be discussing using Docker to scale out your Logstash deployment.
The Challenges
If you have ever used Logstash (LS) to push logs to Elasticsearch (ES) here are a number of different challenges you may encounter:
- Synchronization: of versions when upgrading ES and LS
- Binding: to port 514 on a Linux host as it is a reserved port
- High availability: with 100% always-on even during upgrades
- Configurations management: across Logstash nodes
When looking at solutions, the approach I take is:
- Maintainability
- Reliability
- Scalability
The Solution
Using Docker, a generic infrastructure can be deployed due to the abstraction of containers and underlying OS (Besides the difference between Windows and Linux hosts).
Docker solves the challenges inherent in the LS deployment:
- Synchronization: Service parallelism is managed by Docker and new LS versions can be deployed just by editing the Docker Compose file
- Port bindings: The docker service is able to bind on Linux hosts port 514 which can be forwarded to the input port exposed by your pipeline
- High availability: Using replica settings, you can ensure that a certain amount of LS deployments will always be deployed as long as there is always one host available. This makes workload requirements after load testing purely a calculation as follows:
- Max required logs per LS instance = (Maximum estimated Logs)/(N Node)
- LS container size = LoadTestNode(Max required logs per LS instance)
- Node Size = LS container size * 1 + (Max N Node Loss)
I.e. Let’s say you have 1M logs required to be logged per day, and have a requirement to have 3 virtual machines for a maximum of 1 virtual machine loss.
- 333,333 = 1M / 3
- Assume 2 CPU, 4 GB RAM
- 4 CPU, 8 GB = (2 CPU , 4 GB RAM) * 2
Why not deploy straight onto OS 3 Logstashes sized at 4 CPU and 8 GB RAM?
- Worker number does not scale automatically when you increase the CPU count and RAM, as such even with more CPU and RAM you cannot ensure that you will effectively be able to continue ingesting the same amount of logs in a “Node down” situation
- Upgrading the Logstashes become a OS level activity with associated headache
- Restrictive auto-scaling capability
- No central stout view of Logstashes
Architecture
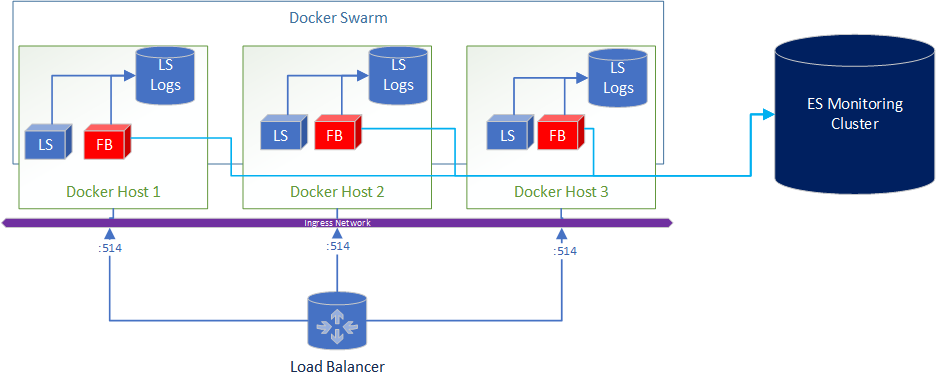
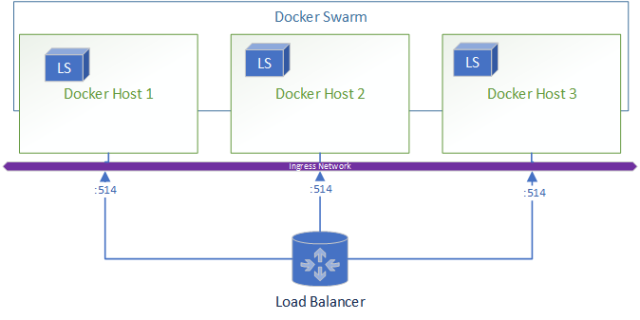
Let’s take a look at how this architecture looks,
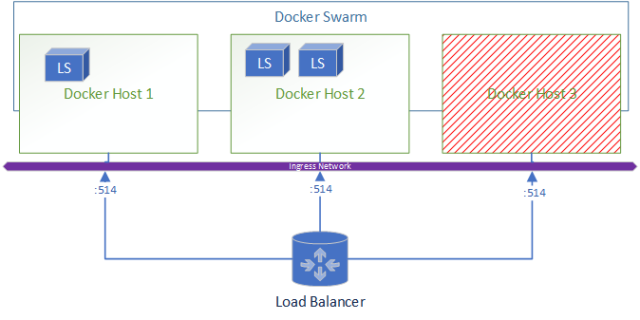
When a node goes down the resulting environment looks like:
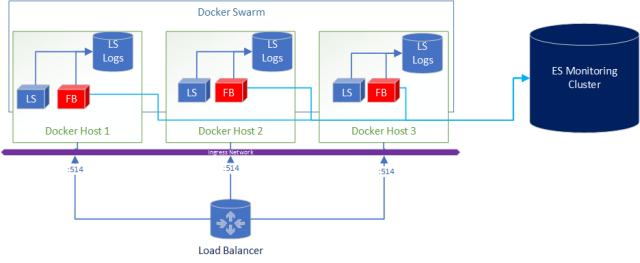
A added bonus to this deployment is if you wanted to ship logs from Logstash to Elasticsearch for central and real-time monitoring of the logs its as simple as adding Filebeats in the docker-compose.
What does the docker-compose look like?
version: '3.3'
services:
logstash:
image: docker.elastic.co/logstash/logstash:6.4.0#Change image to change LS version
volumes:
- /etc/logstash:/usr/share/logstash/config #Location of the config
networks:
- logstash
ports:
- 1514:1514/udp
- 9600:9600
- 1514:1514
- 514:1514/udp # Map from host 514 to a defined pipeline for 1514
- 514:1514
deploy:
mode: global
placement:
constraints:
- node.role == manager
update_config:
parallelism: 1
delay: 10s
resources: #LS size
limits:
cpus: 1
memory: 50M
restart_policy:
condition: on-failure
networks:
logstash:
driver: overlay
The steps to implement the basic solution (without Filebeats):
- Estimate the Virtual Machines (VM) sizes and LS sizes based on estimated ingestion of logs and required redundancy
- Deploy VM and install docker
- Create a docker swarm
- Write a logstash.yml and either include the pipeline.yml or if you are using ES configure centralised pipeline management.
- Copy the config to all VM’s to the same file location OR create a shared file system (that is also HA) and store the files there to centrally manage config
- Start your docker stack after customizing the docker-compose file shared in this article
- Set up a external load balancer pointing at all your virtual machines
- Enjoy yummy logs!
The BUT!
As with most good things, there is a caveat. With Docker you add another layer of complexity however I would argue that as the docker images for Logstash are managed and maintained by Elasticsearch, it reduces the implementation headaches.
In saying this I found one big issue with routing UDP traffic within Docker.
This issue will cause you to lose a proportional number of logs after container re-deployments!!!
- What is your current logging deployment?
- Have any questions or comments?
- Are interested seeing a end-to-end video of this deployment?
- Comment below!
Disclaimer: This article only represents my personal opinion and should not be considered professional advice. Healthy dose of skeptism is recommended.