It is a common requirement to export the data in Elasticsearch for users in a common format such as .csv. An example of this is exporting syslog data for audits. The easiest way to complete this task I have found is to use python as the language is accessible and the Elasticsearch packages are very well implemented.
In this post we will be adapting the full script found here.
1. Prerequisite
To be able to test this script, we will need:
- Working Elasticsearch cluster
- Workstation that can execute .py (python) files
- Sample data to export
Assuming that your Elasticsearch cluster is ready, lets seed the data in Kibana by running:
POST logs/_doc
{
  "host": "172.16.6.38",
  "@timestamp": "2020-04-10T01:03:46.184Z",
  "message": "this is a test log"
}
This will add a log in the "logs" index with what is commonly ingested via logstash using the syslog input plugin.
2. Using the script
2.1. Update configuration values
Now lets adapt the script by filling in our details for lines 7-13

- username: the username for your Elasticsearch cluster
- password: the password for your Elasticsearch cluster
- url: the url of ip address of a node in the Elasticsearch cluster
- port: the transport port for your Elasticsearch cluster (defaults to 9200)
- scheme: the scheme to connect to your Elasticsearch with (defaults to https)
- index: the index to read from
- output: the file to output all your data to
2.2. Customizing the Query
By default the script will match all documents in the index however if you would like to adapt the query you can edit the query block.

Note: By default the script will also sort by the field "@timestamp" descending however you may want to change the sort for your data
2.3. Customizing the Output
Here is the tricky python part! You need to loop through your result and customize how you want to write your data-out. As .csv format uses commas (new column) and new line values (\n) to format the document the default document includes some basic formatting.

1.The output written to the file, each comma is a new column so the written message will look like the following for each hit returned:
| column 1 | column 2 | column 3 |
|---|---|---|
| result._source.host | result._source.@timestamp | result._source.message |
2. Note that when there is a failure to write to the file, it will write the message to a array to print back.
3. At the end of the script, all the failed messages will be re-printed to the user
2.4. Enjoying your hardwork!
Looking at your directory you will see a output.csv now and the contents will look in excel like:

Solving a 2 year old problem
Logs are usually sent via UDP traffic and most commonly available as a syslog message:
- UDP: Best effort process-to-process based communication
- TCP: Reliable host-to-host based communication
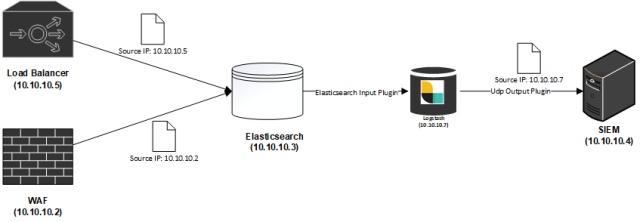
These logs in many products (especially SIEM – Security information and event management) have their sources identified using the source-IP of the packet instead of the content of the message (Often the content of the log does not contain source identification information, this is a result of poor logging design), as such in more complex topologies with log caching or staged log propagation, the source of the logs cannot differentiated by the final system.

This may not matter in a environment where the cache is only caching logs from a single device, however if the cache is centralizing logs from multiple sources, it makes it impossible for the SIEM to differentiate device sources for the logs impacting the functionality available.

This has been a ticket since 04/05/2017.
The ELK Log Forwarding Topology
Elasticsearch is commonly used as a centralization point for logs due to its high ingestion capability as well as the extensive libraries of plugins that can be used for collecting, transforming and forwarding almost all types of data. This is especially important for Service Providers who may have a responsibility such as to both store a copy of logs as well as send a copy to customers for their usage in their own SIEM solutions.
Logstash Output Plugin – Spoof
The default UDP Logstash output plugin does not allow for spoofing the source device (IP Address, Port and MAC). I have written a new Logstash output to enable this behavior. The plugin is able to, on every individual message spoof the Source IP, Source Port and Source MAC Address of the packet. To use the plugin you need to specify additional information about the target device:
- Destination MAC Address (This cannot be resolved from the ARP table at this point in time)
- Interface the traffic is intended to be spoofed from
Getting Started
Pre-Requisites
The plugin uses the jnetpcap library and therefore requires a number of pre-requisites on the host to be completed:
- Add jnetpcap library to OS
- Install Plugin
JNetPCAP
It is possible to run the library on different operating systems, I have tested on Ubuntu 18.04. For instructions on how to run it on other operating systems, there are notes in the Release Notes of the library.
After deploying a new Ubuntu Server with the default Logstash installation, complete the following steps:
- Download the jnetpcap library:
wget -O jnetpcap-1.4.r1425 https://downloads.sourceforge.net/project/jnetpcap/jnetpcap/Latest/jnetpcap-1.4.r1425-1.linux64.x86_64.tgz
- Unzip the files
tar -xvf jnetpcap-1.4.r1425
- Copy the library to the /lib folder
cp jnetpcap-1.4.r1425/libjnetpcap.so /lib/
- Install libpcap-dev (Ubuntu)
sudo apt-get install libpcap-dev
Note: Using Centos, the package is only available via the RHEL optional channel.
Note: If you are running logstash as a service, the default permissions for the logstash user are not sufficient, run the service as root (If anyone knows the exact permissions to harden please DM me).
This can be done by editing /etc/systemd/system/logstash.service if you are using systemctl.
Installing the plugin
You can download the source code and build the code yourself. Alternatively you can download the gem directly from here.
- Move to the logstash folder
cd /usr/share/logstash
- Install the plugin
./bin/logstash-plugin install --no-verify <path-to-gem>/logstash-output-spoof-0.1.0.gem
Testing the plugin
- Create a test pipeline to test
vi /usr/share/logstash/test.conf
- Copy the following pipeline into the file
Note: Remember to replace the values marked to be replaced
input {
  generator { message => "Hello world!" count => 1 }
}
filter {
  mutate {
   add_field => {
      "extra_field" => "this is the test field"
      "src_host" => "3.3.3.3"
   }
   update => {"message" => "this should be the new message"}
  }
}
output {
  spoof {
    dest_host => "<REPLACE WITH YOUR DESTINATION IP>"
    dest_port => "<REPLACE WITH YOUR DESTINATION PORT>"
    src_host => "%{src_host}"
    src_port => "2222"
    dest_mac =>  "<REPLACE WITH YOUR DESTINATION MAC ADDRESS>"
    src_mac => "<REPLACE WITH YOUR MAC ADDRESS>"
    message => "%{message}"
    interface => "ens32"
  }
}
- On the DESTINATION device, you can run tcpdump to collect and observe the traffic
sudo tcpdump -A -i any src 3.3.3.3 -v
Note: You may need to install tcpdump
- On the server hosting the logstash from the /usr/share/logstash path, start the pipeline
./bin/logstash -f test.conf
Note: Be patient, Logstash is very slow to start up
On the target system you are capturing traffic from you should see the source of the packet is coming from 3.3.3.3! Congratulations on spoofing your first message.

Conclusion
In this post I have demonstrated how you can use the new Logstash Plugin to spoof traffic, as this can be done using event based data this plugin can be used to support many exotic deployment topologies that are SIEM compliant.
Using this plugin, hopefully you can support complex log forwarding topologies regardless of what technologies the end device uses.

Summary
When running Logstash in large scale environments it can be quite difficult to troubleshoot performance specifically when dealing with UDP packets.
The issue could occur at multiple layers, in order of dependent layers of concern:
- Infrastructure
- Logstash Application
- Pipeline
The following steps assume installation of Logstash on a Linux machine (CentOS 7.4) but similar steps can be used for other machines.
1. Troubleshooting Infrastructure
Issue: Communication issues from source
Diagnose:
- Dump all packets on a protocol and port (Run on OS with Logstash) to check whether you are receiving data:
tcpdump -i ens160 udp - If it is TCP traffic that is being troubleshooted, you can telnet the port from the source to destination to determine the issue. Example below is run from the source to the destination to diagnose traffic flow to port 514 on Logstash with ip 10.10.10.4.
telnet 10.10.10.4 514
Fixes:
- Check all interim networking devices (Firewalls, load-balancers, switches etc.) and ensure at every leg the traffic is getting through.
Issue: Dropped UDP Packets
Diagnose:
- View the network statistics (Run on OS with Logstash) to check whether your operating system is dropping packets.
A good read on how to view the results of this command can be found herewatch netstat -s --udp
Fixes:
-
If there is packet loss, check the CPU of the nodes the Logstash is pointed at (should be hot).
-
Commercial Only: Check the pipeline via monitoring to verify where there is a high processing time.

2. Troubleshooting Logstash Application
Issue: Logstash keeps restarting
Diagnose:
- Print the journal of the service to see the errors
journalctl -u logstash.service
- Cat logs stored at /var/log/logstash/~
Fix:
- The application maybe trying to listen on port 514 with insufficient permission, you can use iptables to forward the traffic to a privileged port. Discussion can be found here.
- Commercial Only (X-Pack security): The application maybe failing to connect to the Elasticsearch nodes due to incorrect certificate, check that the assigned CA is correct.
3. Troubleshooting Pipelines
Issue: Pipeline is not passing logs to Elasticsearch
Diagnose:
- Cat logs stored at /var/log/logstash/~
- Review the pipeline to ensure output is using Elasticsearch output plugin, add a stdout output to ensure logs are reaching end of pipeline
- Check the inputs to ensure the right port is binded
Fix
- Instead of using the syslog input, swap to the tcp/udp input to diagnose whether it is the input plugin
- Check all drop() commands in the filters
Why Log to Elasticsearch?
Elasticsearch is a fantastic tool for logging as it allows for logs to be viewed as just another time-series piece of data. This is important for any organizations’ journey through the evolution of data.
This evolution can be outlined as the following:
- Collection: Central collection of logs with required indexing
- Shallow Analysis: The real-time detection of specific data for event based actions
- Deep Analysis: The study of trends using ML/AI for pattern driven actions
Data that is not purposely collected for this journey will simply be bits wondering through the abyss of computing purgatory without a meaningful destiny! In this article we will be discussing using Docker to scale out your Logstash deployment.
The Challenges
If you have ever used Logstash (LS) to push logs to Elasticsearch (ES) here are a number of different challenges you may encounter:
- Synchronization: of versions when upgrading ES and LS
- Binding: to port 514 on a Linux host as it is a reserved port
- High availability: with 100% always-on even during upgrades
- Configurations management: across Logstash nodes
When looking at solutions, the approach I take is:
- Maintainability
- Reliability
- Scalability
The Solution
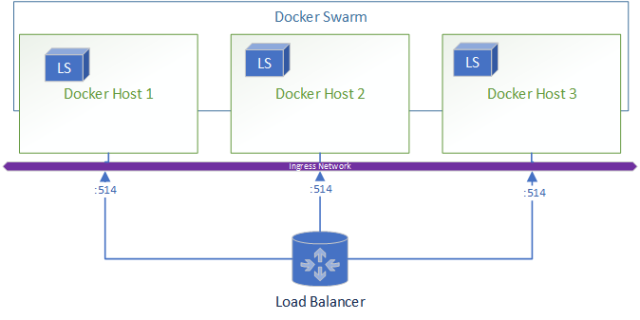
Using Docker, a generic infrastructure can be deployed due to the abstraction of containers and underlying OS (Besides the difference between Windows and Linux hosts).
Docker solves the challenges inherent in the LS deployment:
- Synchronization: Service parallelism is managed by Docker and new LS versions can be deployed just by editing the Docker Compose file
- Port bindings: The docker service is able to bind on Linux hosts port 514 which can be forwarded to the input port exposed by your pipeline
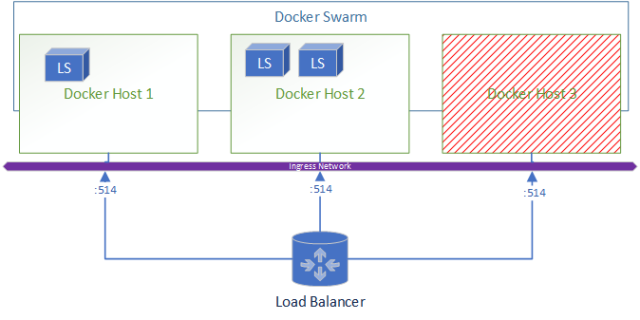
- High availability: Using replica settings, you can ensure that a certain amount of LS deployments will always be deployed as long as there is always one host available. This makes workload requirements after load testing purely a calculation as follows:
- Max required logs per LS instance = (Maximum estimated Logs)/(N Node)
- LS container size = LoadTestNode(Max required logs per LS instance)
- Node Size = LS container size * 1 + (Max N Node Loss)
I.e. Let’s say you have 1M logs required to be logged per day, and have a requirement to have 3 virtual machines for a maximum of 1 virtual machine loss.
- 333,333 = 1M / 3
- Assume 2 CPU, 4 GB RAM
- 4 CPU, 8 GB = (2 CPU , 4 GB RAM) * 2
Why not deploy straight onto OS 3 Logstashes sized at 4 CPU and 8 GB RAM?
- Worker number does not scale automatically when you increase the CPU count and RAM, as such even with more CPU and RAM you cannot ensure that you will effectively be able to continue ingesting the same amount of logs in a “Node down” situation
- Upgrading the Logstashes become a OS level activity with associated headache
- Restrictive auto-scaling capability
- No central stout view of Logstashes
Architecture
Let’s take a look at how this architecture looks,
When a node goes down the resulting environment looks like:
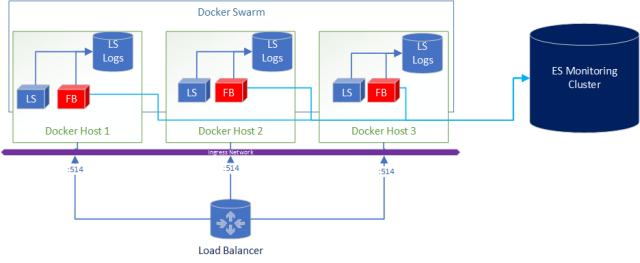
A added bonus to this deployment is if you wanted to ship logs from Logstash to Elasticsearch for central and real-time monitoring of the logs its as simple as adding Filebeats in the docker-compose.
What does the docker-compose look like?
version: '3.3'
- Estimate the Virtual Machines (VM) sizes and LS sizes based on estimated ingestion of logs and required redundancy
- Deploy VM and install docker
- Create a docker swarm
- Write a logstash.yml and either include the pipeline.yml or if you are using ES configure centralised pipeline management.
- Copy the config to all VM’s to the same file location OR create a shared file system (that is also HA) and store the files there to centrally manage config
- Start your docker stack after customizing the docker-compose file shared in this article
- Set up a external load balancer pointing at all your virtual machines
- Enjoy yummy logs!
The BUT!
As with most good things, there is a caveat. With Docker you add another layer of complexity however I would argue that as the docker images for Logstash are managed and maintained by Elasticsearch, it reduces the implementation headaches.
In saying this I found one big issue with routing UDP traffic within Docker.
This issue will cause you to lose a proportional number of logs after container re-deployments!!!
- What is your current logging deployment?
- Have any questions or comments?
- Are interested seeing a end-to-end video of this deployment?
- Comment below!
Disclaimer: This article only represents my personal opinion and should not be considered professional advice. Healthy dose of skeptism is recommended.
]]>If you are currently developing using C# (Particularly .NET Core 2.0+) here are some shortcuts I hope will be able to save you time I wish I could have back.
There is official documentation for C# Elasticsearch development however I found the examples to be quite lacking. I do recommend going through the documentation anyway especially for the NEST client as it is essential to understand Elasticsearch with C#.
1. Low Level Client
“The low level client,
ElasticLowLevelClient, is a low level, dependency free client that has no opinions about how you build and represent your requests and responses.”
Unfortunately the low level client in particular has very sparse documentation especially examples. The following was discovered through googling and painstaking testing.
1.1. Using JObjects in Elasticsearch
JObjects are quite popular way to work with JSON objects in .NET, as such it may be required to parse JObjects to Elasticsearch, this may be a result of one of the following:
- Definition of the object is inherited from a different system and only parsed to Elasticsearch via your application (i.e. micro-service)
- Too lazy to strongly define each object as it is unnecessary
The JObject cannot be used as the generic for indexing as you will receive this error:
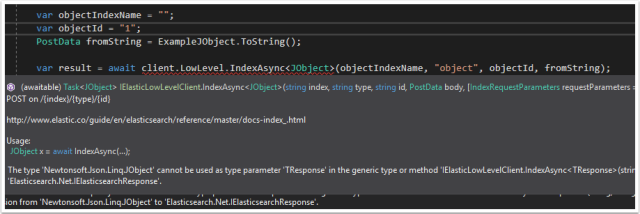
Instead use “BytesResponse” as the <T> Class

1.2. Running a “Bool” query
The examples given by the Elasticsearch documentation does not give an example of a bool query using the low-level client. Why is the “Bool” query particularly difficult? Using Query DSL in C#, “bool” will automatically resolve to the class and therefore will throw a error:
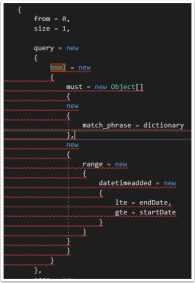
Not very anonymous type friendly… the solution to this one is quite simple, add a ‘@’ character in-front of the bool.
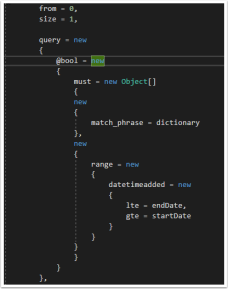
1.3. Defining Anonymous Arrays
This one seems a-bit obvious but if you want to define an array for use with DSL, use the anonymous typed Array (Example can be seen in figure 4) new Object[].
1.4. Accessing nested fields in searches
Nested fields in Elasticsearch are stored as a full path, . delimited string. This creates a problem when trying to query that field specifically as it creates a invalid type for anonymous types.

The solution is to define a Dictionary and use the dictionary in the anonymous type.
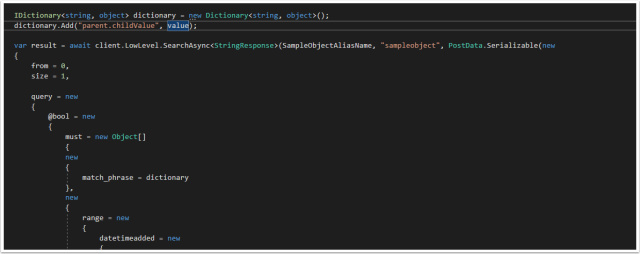
The Dictionary can be passed by the anonymous type and will successfully query the Nested field in Elasticsearch.
2. NEST Client
“The high level client,
ElasticClient, provides a strongly typed query DSL that maps one-to-one with the Elasticsearch query DSL.”
The NEST documentation is much more comprehensive, the only issue I found was using keyword Term searches.
2.1. Using Keyword Fields
All string fields are mapped by default to both text and keyword, the documentation can be found here. Issue is that in the strong typed object used in the Elastic Mapping there is no “.keyword” field to reference therefore a error is thrown.
Example:
For the Object:
public class SampleObject

{

public string TextField { get; set; }

}
Searching would look like this

Unfortunately the .Keyword field does not exist, the solution is using the .Suffix function using property name inference. This is documented in the docs however it is not immediately apparent that is how you access “keyword”.

I hope this post was helpful and saved you some time. If you have any tips of your own please comment below!
]]>
